What Is Technographic Data?
Technographic data is information about the technologies a company uses, including its software, platforms, and tools. It helps B2B teams understand a company’s tech stack, identify gaps, and target it more effectively.
It shows you what is in a company’s tech stack before you reach out. Instead of guessing, you can see what they use, what they recently adopted, and what they might be replacing. That context changes how you approach them.
Example: You sell a sales engagement platform. Technographic data shows that a target account runs Salesforce as their CRM but has no outbound sequencing tool connected to it. That gap is your entry point. You are not pitching cold. You are starting a conversation that already makes sense.
B2B technographic data typically covers:
- CRM and sales tools (Salesforce, HubSpot, Pipedrive)
- Marketing automation platforms (Marketo, Pardot, ActiveCampaign)
- Analytics and BI tools (Google Analytics, Tableau, Looker)
- Cloud infrastructure providers (AWS, Azure, GCP)
- Customer support software (Zendesk, Intercom, Freshdesk)
- E-commerce and payments platforms (Shopify, Stripe, Magento)
Knowing what a company uses helps you assess fit. Knowing how that stack is changing helps you assess timing. Both matter. That combination is what makes technographic data more than a data point. It is the foundation for smarter, more contextual outreach.
Why Technographic Data Matters in B2B
Now that you understand what it is, here is why it actually moves the needle for B2B teams.
Technographics are not a nice-to-have. They are a competitive lever that directly affects pipeline quality, outreach relevance, and conversion rates.
- Better ICP fit: You can filter accounts by the tools they use, not just their industry or headcount. Your ideal customer profile gets sharper, and your list gets cleaner.
- More relevant outreach: When you know a prospect uses a competitor or a complementary tool, your message can reference that directly. It goes from generic to genuinely useful.
- Shorter sales cycles: Reaching companies that already use adjacent technology means less time educating and more time discussing fit.
- Smarter ABM: Account-based marketing campaigns get more precise when targeting is built around tech stack, not just company profile.
- Real competitive intelligence: Knowing which tools your prospects already use gives your reps a specific edge in every conversation.
The teams using technographic data well are not prospecting harder. They are prospecting smarter. And that precision shows up directly in conversion rates.
To use it well, though, you first need to understand what types of technographic data actually exist and what each one tells you.
Types of Technographic Data
Before you can act on technographic data, it helps to understand what you are looking at. Not all of it tells you the same thing, and the difference matters for how you use it.
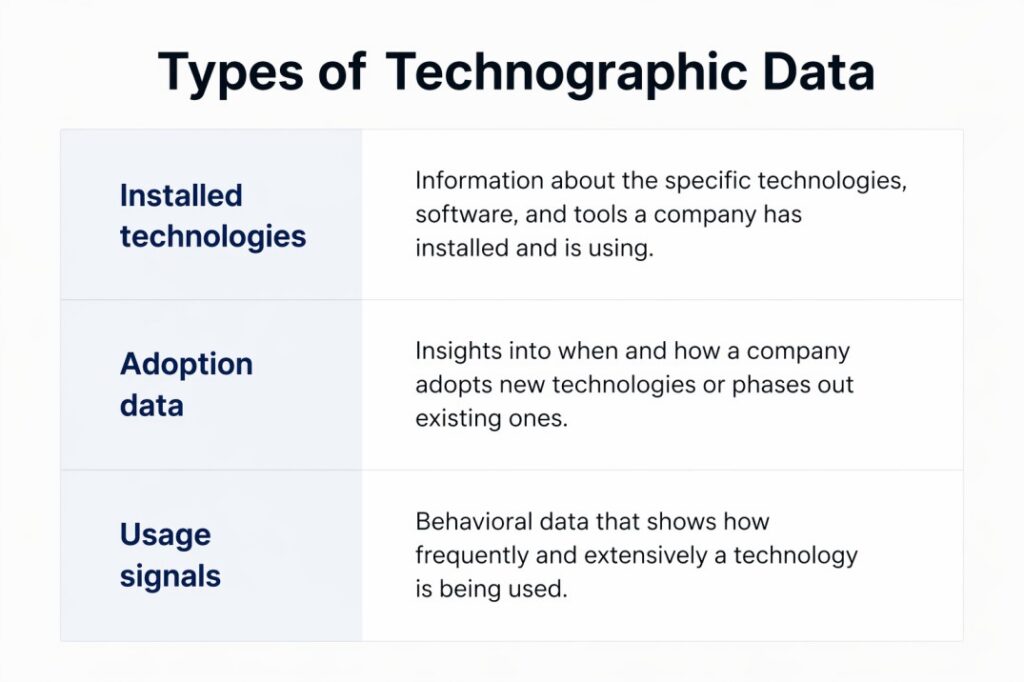
Installed technologies are the baseline. This is the list of tools a company currently has in place: their CRM, analytics platform, email tool, and so on. It tells you what exists right now. Most teams stop here. That is the first mistake, because installed technology alone does not tell you anything about momentum or change.
Adoption data goes a layer deeper. It shows you when a tool was adopted and, in some cases, how broadly it is being used across the organization. A company that adopted a new platform six months ago is in a very different position than one running the same setup for four years. Newer adoptions often signal active investment and building. That is worth knowing before you reach out.
Usage signals are the most dynamic layer. They reflect how actively a company is engaging with a tool. Growing usage suggests deep investment. Declining engagement can signal that a replacement decision is coming. This is where technographic data starts to feel less like a database and more like intelligence.
Most teams only look at installed technologies. The teams that build in adoption data and usage signals are the ones who reach accounts at the right moment, not months after the opportunity closed.
What Are Technology Signals?
Technology signals are indicators of changes in a company’s tech stack and often point to digital transformation initiatives happening inside a company.
They tell you:
- what tools were added
- what tools were removed
- what tools are being expanded
Here is the difference:
- A company using HubSpot → technographic data
- A company upgrading HubSpot and adding integrations → technology signal
Technographic data shows what a company has.
Technology signals show what a company is doing right now.
This matters because timing matters. Most B2B teams don’t know when to reach out. Technology signals show when a company is actively changing its setup, which is when they are more likely to evaluate new tools.
There are three types of technology signals, and each one points to a different kind of opportunity.
Types of Technology Signals and What They Mean
Not all technology signals mean the same thing. Each one points to a different kind of opportunity and requires a different approach.
Adoption Signals
An adoption signal shows when a company starts using a new technology. It usually means they are investing, experimenting, or building something new.
Example: A mid-market company adopts a customer data platform. If you sell a tool that integrates with CDPs, this is your entry point. They are already investing in their data stack and likely exploring related tools.
Adoption signals are best for discovery conversations. The company is in build mode. Outreach that connects to what they just adopted will land better than a generic pitch.
Replacement Signals
A replacement signal shows when a company moves from one tool to another. This is the strongest signal you can get.
Example: A company drops Marketo and starts testing other marketing automation tools while hiring for marketing ops roles. They are not thinking about switching. They are already in the process.
Replacement signals require speed. The account is ready to buy. You need to reach them before they commit elsewhere.
Expansion Signals
An expansion signal shows when a company is scaling its use of a tool. This could mean more users, new modules, or additional integrations.
Example: A company grows from 15 to 60 Salesforce seats in 90 days. Their sales team is expanding quickly. If you sell CRM add-ons or sales enablement tools, this is a strong opportunity.
Expansion signals are ideal for complementary products. The company is already investing, and you can align with that momentum.
Each signal maps to a different moment in the buyer journey. Getting that match right is what turns technographic data into a real pipeline driver.
How Do B2B Teams Use Technographic Data?
Technographic data only creates value when it is embedded into how teams actually work. Here is how it shows up in practice across sales, marketing, and RevOps.
Sales Teams
Sales reps use technographic data to qualify faster and personalize outreach in a way that actually resonates.
- Stack-based qualification: A rep selling a Salesforce integration does not need to call companies using a different CRM. Technographics remove those calls before they happen.
- Competitor displacement: If a prospect runs a direct competitor, the rep can lead with a specific differentiation story built around what the prospect already has and what it is likely costing them.
- Real conversation starters: Instead of “I wanted to connect about our platform,” the rep can say: “I noticed you recently adopted HubSpot. A lot of teams in your space hit the same bottleneck three to six months in. Want to talk about it?” That specificity is not a trick. It is the difference between outreach that gets deleted and outreach that gets a reply.
Marketing Teams
Marketers use technographic data to move past demographic segmentation and build campaigns that speak to how a company is actually set up.
- Stack-based audience segments: Target companies using specific tools and serve them content that maps directly to their situation, not a generic version of your value proposition.
- Campaign personalization at scale: Run separate campaign tracks for companies using Salesforce vs. HubSpot vs. no CRM at all. The messaging, proof points, and calls to action should all be different.
- Competitive displacement campaigns: Run targeted ads to users of competing platforms. Speak to their specific frustrations rather than leading with generic feature lists.
RevOps Teams
RevOps uses technographic data to build the scoring and enrichment infrastructure that makes the rest of the team more effective.
- Enriched lead scoring: Add technology signals to your scoring model so accounts making relevant stack changes automatically surface at the top.
- CRM enrichment: CRM enrichment Keep’s technographic fields continuously updated so reps are never working from outdated information.
- TAM segmentation: Break your total addressable market into segments by tech stack so you can focus resources where they will have the most impact.
When all three teams work from the same technographic signals, the entire go-to-market motion becomes faster and more aligned. But knowing the data and actually acting on it are two different things.
How to Turn Technographic Data into Buying Signals
This is where most teams fall short. They collect technographic data, look at it occasionally, and do not build it into a real workflow. Raw technographic data is not a buying signal on its own. Interpreted and layered correctly, it becomes one.
Here is how to make that translation:
Step 1: Map the tech stack of your best customers. Start with the accounts that converted quickly, stayed longest, and expanded over time. What tools were they using before they bought from you? What tools do they still run alongside your product? This gives you a technology fingerprint to match against when prospecting.
Step 2: Identify stack gaps. Look for accounts that have part of the ideal stack but not all of it. A company with a CRM but no sales engagement tool. A company with a data warehouse but no reporting layer. Those gaps are visible, and if your product fills one of them, you have a concrete and specific reason to reach out.
Step 3: Layer in signals. Do not just look at what tools a company has. Look at what changed recently. New adoptions, dropped tools, and rapid seat expansion are all indicators that a company is in motion. Companies in motion are far easier to sell to than those in stasis.
Step 4: Prioritize by signal strength. Not all signals carry equal weight. A company that dropped a competitor, expanded headcount, and has open job postings in a relevant function is a much hotter prospect than a company whose stack has not changed in 18 months. Rank your pipeline by signal intensity, not just company profile.
Step 5: Trigger outreach at the right moment. Set up workflows so that when a relevant signal fires, it immediately routes to the right rep or starts a personalized sequence. The goal is to catch the buyer while they are in motion, not weeks later when the window has closed.
Real-world scenario: A RevOps team at a SaaS company builds an alert that fires when target accounts drop their current analytics platform and post two or more data-related job openings in the same 30-day window. When both conditions are met, the account is flagged as high-priority and routed to a senior rep with a pre-built, context-specific sequence. No manual research needed. No missed windows.
This is technographic data used as an operating system for your GTM team, not just a lookup table you check occasionally.
Technographic Data Providers: What to Look For
Most teams understand the value of technographic data but struggle with how to access it consistently and at scale.
Choosing the right provider depends on a few key factors:
- Accuracy: How reliable is the data, especially for internal tools?
- Freshness: How often is the data updated?
- Signal coverage: Does it capture changes like adoptions, replacements, and expansions?
- Workflow integration: Can signals trigger actions inside your CRM or sales tools?
There are several technographic data providers in the market, each offering different levels of coverage and depth.
This is where platforms like Pintel.AI come in. Instead of just providing static technographic data, Pintel focuses on identifying real-time technology signals and helping teams act on them through workflows.
How Is Technographic Data Different from Firmographic and Intent Data?
These three data types often come up together, but they answer completely different questions. Mixing them up or treating them as interchangeable leads to gaps in your targeting.
Firmographic data answers: who is this company?
It covers industry, headcount, revenue, location, and funding stage. It tells you whether a company fits your profile but says nothing about what they are using or what they need right now.
Technographic data answers: what does this company use?
It tells you what tools and platforms they have in place and how that stack is changing. It helps you assess fit at the technology level, which is far more specific than firmographic fit alone.
Intent data answers: what is this company actively researching?
It captures behavioral signals: which topics employees are reading about, which categories they are searching, which review sites they are visiting.
Put together, here is what that looks like in practice: Firmographic data tells you a company has 300 employees in the fintech space. Technographic data tells you they use Salesforce but have no marketing automation connected to it. Intent data tells you they have been researching marketing automation for financial services for the past three weeks. Each data type fills a different gap. Together, they paint a picture of an account that fits your profile, has a visible need, and is actively looking to solve it right now.
Technographic data fills the specific layer that firmographics and intent data both miss: what the company is actually running and where the gaps are. That context is what makes outreach feel relevant rather than random.
How Is Technographic Data Collected?
Knowing how this data is gathered helps you evaluate its quality and understand what it can and cannot tell you.
- Web crawling: Automated tools scan publicly visible signals on company websites, including tracking pixels, embedded scripts, and third-party libraries.
- Job posting analysis: A company advertising for five Salesforce administrators is clearly invested in the platform. Job postings reveal what companies are using, scaling, or planning to build, even when that information is not visible on their website.
- Vendor partnership data: Some technology vendors share anonymized customer or integration data with data providers through formal agreements. This can surface tools that leave no public trace.
- Survey and panel data: Direct surveys with IT professionals and business decision-makers produce self-reported data that tends to be more accurate for internal tools.
- Crowd-sourced data: Platforms that aggregate tool usage information from users and companies contribute to a broader and more complete picture.
The collection method matters because it determines what is visible and what is not. The best providers combine multiple methods and refresh data on a regular cadence. That freshness question is also where many teams run into problems, which brings us to the real challenges with technographic data.
Challenges with Technographic Data
Technographic data is a powerful tool, but it has real limitations. The teams that use it well are the ones who understand those limits and work within them.
Accuracy
Not every technology leaves a visible footprint. Internal tools, custom-built software, and platforms that do not embed publicly detectable code are often invisible to crawlers. This is especially true for large enterprises with complex, proprietary infrastructure. Most teams treat technographic data as a complete picture of a company’s stack. That is the mistake. Treat it as a strong directional view and use it to guide outreach, not as the sole basis for a major decision.
Freshness
Tech stacks change faster than most data providers update their records. A company that was running a tool six months ago may have replaced it last quarter. In replacement scenarios, where timing is everything, stale data does real damage. It erodes credibility and can send reps in completely the wrong direction. Ask your provider how frequently records are refreshed and build a CRM hygiene cadence that matches.
Coverage
Coverage is uneven. Large enterprises and US-based companies tend to have thorough technographic profiles. Smaller companies, startups, and businesses in international or emerging markets often have thinner coverage, sometimes none at all. If your target market skews toward smaller or international accounts, factor this into how much you rely on the data and supplement with other signals where coverage is thin.
None of these challenges make technographic data less valuable. They just mean it works best as intelligence that guides decisions, not as a hard rule that replaces judgment.
Best Practices for Using Technographic Data
Here are the practices that actually move the needle, not in theory but in how real GTM teams operate day to day.
- Combine it with firmographic and intent data. Technographics alone do not tell the whole story. The overlap between all three, right profile, right stack, and right timing, is where your best opportunities live. Always start there.
- Build a technology layer into your ICP. Most ICP definitions stop at industry and headcount. Add a technology dimension: what tools do your best customers use? What were they running before they bought from you? Let those patterns shape who you target.
- Use signals to trigger workflows, not just to inform research. The moment a relevant signal fires should automatically kick off an action: a task in the CRM, a personalized sequence, or a shift in ad targeting. Manual processes miss too many windows.
- Refresh your data on a defined cadence. Set a schedule to update technographic fields in your CRM, at minimum quarterly. Outreach built on stale data hurts your credibility, especially in replacement conversations where timing is the whole game.
- Personalize around what you know, not just that you know it. “We noticed you use X” is a weak opener. “Teams running X often hit this specific challenge, and here is how we address it” is far stronger. Specificity shows understanding, not just access to a data tool.
- Track which signals actually correlate with conversion for your product. Over time, you will find that certain tool combinations or recent adoption patterns predict pipeline quality. Lean into those patterns and keep refining your scoring model as the data accumulates.
From Technographic Data to Real Pipeline Impact
Most B2B teams are sitting on an advantage they have not fully unlocked. The companies they want to reach are already communicating through their technology choices: what they have adopted, what they are replacing, and where they are investing. Technographic data is how you learn to read those signals before your competitors do.
When you know what tools a company uses, you target smarter. When you track how that stack is changing, you reach out at the right moment. And when you layer technographic data with firmographic fit and intent signals, you build a clear, actionable picture of who is ready to buy and why.
The B2B teams winning right now are not the ones with the longest lists. They are the ones with the most relevant context at the moment of outreach. Technographic data is how you build that context, one signal at a time.
Frequently Asked Questions
What is technographic data?
Technographic data is information about the technologies a company uses, including its software, platforms, and tools. It gives B2B teams visibility into a company’s tech stack so they can identify fit, find stack gaps, and time their outreach around real changes in how a company is set up.
How is technographic data collected?
It is gathered through web crawling (detecting scripts and tags on company websites), job posting analysis, vendor partnership data, and direct surveys with technology buyers. Different providers use different combinations of these methods, which affects accuracy, freshness, and depth of coverage.
How is technographic data different from intent data?
Technographic data tells you what tools a company uses. Intent data tells you what topics or categories a company is actively researching right now. Technographics reveal tech stack fit. Intent data reveals buying readiness. Both are most powerful when used together alongside firmographic data.
How accurate is technographic data?
Accuracy depends on the provider and collection method. Web-crawled data works well for publicly visible technologies but misses internal tools. Survey-based data is more accurate for internal stack information but slower to update. Treat technographic data as high-quality directional intelligence rather than a guaranteed source of truth, and keep your records refreshed on a regular cadence.
What are technology signals?
Technology signals are dynamic indicators of change in a company’s tech stack. Unlike static technographic data, signals capture movement: a company adopting a new tool, dropping an existing one, or rapidly scaling usage. Signals help GTM teams identify the right moment to reach out, not just the right company.
How do B2B teams turn technographic data into buying signals?
By matching technographic patterns against the stack of your best customers, identifying visible gaps, and layering in recent signals such as adoptions, replacements, and expansions. When those patterns align with strong firmographic fit and active intent, that combination is your buying signal. Build automated workflows that trigger outreach when those conditions are met.