Most B2B teams have a targeting problem and they do not know it yet.
They are running campaigns, sending sequences, building pipeline. But when you look at the win data, a pattern shows up: the accounts that closed were never random. They shared a profile, same industry, similar size, comparable revenue, overlapping geography.
That profile is built from firmographic data. Teams that define it early and use it systematically close faster, waste less, and scale smarter than the ones still targeting by gut feel.
This guide breaks down what firmographic data is, why it is more misunderstood than most people admit, and exactly how sales, marketing, and RevOps teams use it to run a tighter go-to-market.
What Is Firmographic Data?
Firmographic data is company-level information used to describe and classify businesses based on attributes such as industry, employee count, annual revenue, location, ownership type, and growth stage.
If demographic data tells you about a person (their age, title, department), firmographic data tells you about the organization they belong to. Industry, size, revenue, location, ownership structure: these are firmographic attributes.
A quick example: You sell compliance software. Your best customers tend to be US-based financial services firms with 150 to 800 employees and $25M to $200M in revenue. That is firmographic data working as a filter. Instead of targeting all financial services companies, you now have a precise profile you can act on.
Most teams either do not define it clearly or define it once and never revisit it. That is where things break down.
Key Firmographic Attributes B2B Teams Actually Use
To use firmographic data effectively, you need to understand which attributes actually matter and why each one earns its place in your targeting model.
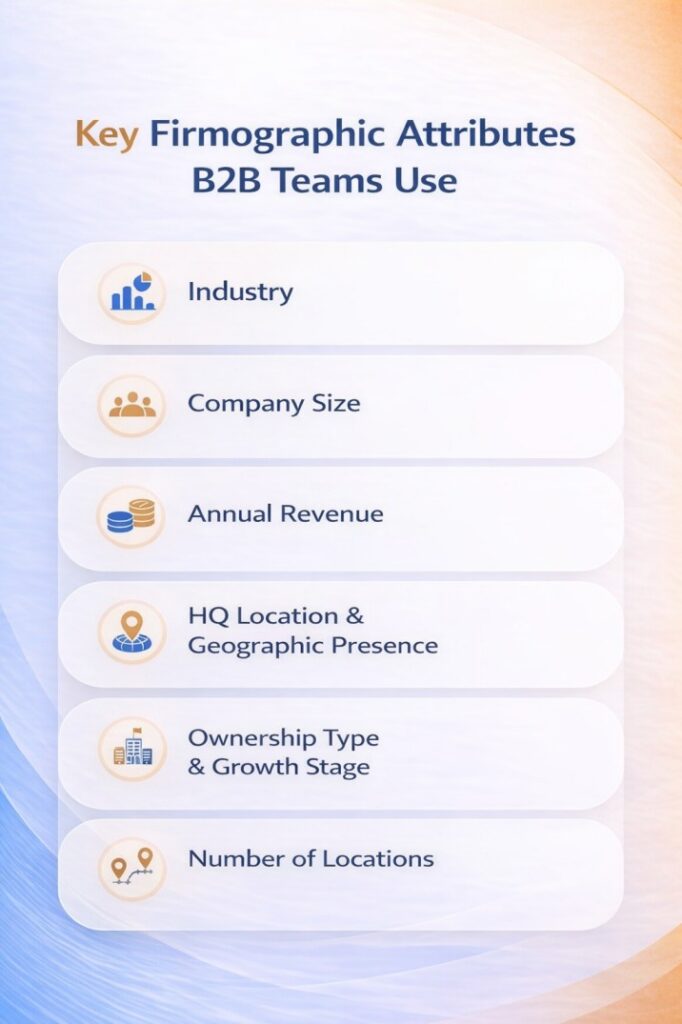
Industry
The sector a company operates in, typically classified by SIC or NAICS codes. Industry is your first filter because it determines whether your product is even relevant. A cybersecurity tool built for healthcare has a completely different buyer than one built for e-commerce.
Company Size (Headcount)
Measured by number of employees. Common bands: SMB (1 to 99), mid-market (100 to 999), enterprise (1,000 and above). Size affects how decisions get made, how long cycles run, and what budget authority looks like.
Annual Revenue
Revenue signals buying power and deal ceiling. A company with $5M in revenue has a fundamentally different budget conversation than one with $500M. Revenue combined with headcount often tells a richer story than either attribute alone.
HQ Location and Geographic Presence
Where a company is based affects sales coverage, legal compliance considerations (GDPR, CCPA), and time zone alignment for customer success. A company with 12 offices across three continents has different needs than one consolidated in a single city.
Ownership Type and Growth Stage
Public vs. private matters. PE-backed companies often move faster and have clearer financial mandates. VC-funded startups may have budget and urgency but shorter runway. Growth stage signals timing and budget availability and changes how you sell and to whom.
Number of Locations
Relevant for solutions that touch physical infrastructure, regional compliance, or field teams. Operational complexity, not just size, is the signal here.
These attributes form the foundation. Next, let us look at what happens when teams collect this data but fail to use it properly.
Common Firmographic Data Fields
While the exact fields vary by company, most B2B sales and marketing teams rely on a core set of firmographic attributes when segmenting accounts and defining their ideal customer profile.
| Field | Example |
|---|---|
| Industry | Healthcare |
| Employee Count | 500 |
| Revenue | $100M |
| Location | California |
| Ownership Type | Private |
| Funding Stage | Series B |
| Number of Offices | 12 |
| NAICS Code | 541511 |
These fields help teams identify which companies fit their target market, prioritize accounts, and personalize outreach at scale.
Why Most Teams Underuse Firmographic Data (And What It Costs Them)
Having firmographic data is not the same as using it well.
Many teams collect it, load it into a CRM, and then it sits there. Fields get incomplete. Segments never get built. Everyone defaults to targeting mid-market tech companies without defining what that actually means.
The result: reps spend time on accounts that fit loosely instead of tightly. Marketing sends the same campaign to a 20-person startup and a 2,000-person enterprise. RevOps cannot report on segment performance because the segments do not exist in any structured way.
A real example: A SaaS company selling project management tools had 4,200 accounts in their CRM. Industry and headcount fields were populated for fewer than 40% of records. Their lead scoring ran entirely on behavioral signals: webinar attendance, page visits, email opens. A funded 15-person startup scored higher than a 300-person manufacturing firm in their ICP, simply because the startup clicked more emails. When they audited closed-won data, every deal over $25K came from mid-market operations and logistics companies. None of that was reflected in how they prioritized pipeline. They had the data. They just were not using it.
What firmographic data actually enables when used properly:
- Market segmentation with real teeth: You stop targeting SaaS companies and start targeting vertical SaaS companies with 100 to 500 employees in regulated industries. Different list, different message, different close rate.
- An ICP that means something: Without firmographic criteria, your Ideal Customer Profile is a story you tell yourself. With it, it becomes a filter you can apply.
- Personalization beyond the name merge: Knowing a company’s industry, stage, and size lets you lead with a pain point that is relevant to their world.
- Resource allocation that reflects reality: Firmographic fit is one of the strongest predictors of conversion likelihood. Prioritize accordingly.
Key takeaway: Firmographic data is only valuable when it drives decisions, not just when it exists in your CRM.

Firmographic Data Examples
Here is what firmographic targeting looks like across common B2B scenarios:
- A compliance software company targets US-based financial services firms with 150 to 800 employees and $25M to $200M in revenue.
- A document automation platform focuses on legal and professional services firms, privately held, with 75 to 400 employees.
- An enterprise SaaS vendor separates companies with 1,000 or more employees and $100M or more in revenue from their broader database for ABM targeting.
- A VP of Sales divides territory using headcount bands: under 100 (SMB), 100 to 999 (mid-market), 1,000 and above (enterprise).
In each case, firmographic data makes the decision repeatable rather than a judgment call made differently by each person on the team.
How B2B Teams Use Firmographic Data Across the GTM Motion
The practical value of firmographic data shows up differently depending on where you sit.
Sales
Sales teams use firmographic data to answer one question before anything else: is this account worth my time?
- Account prioritization: Reps filter territory by ICP-matching criteria, industry, size, revenue, to surface the highest-fit accounts first.
- Prospecting: Firmographic filters replace guesswork when building outbound lists. Reps use defined criteria to pull lists that match the ICP.
- Territory carving: Headcount and geography are the logical basis for dividing accounts across a rep team.
- Inbound qualification: Firmographic data tells a rep within 30 seconds whether an inbound lead is worth pursuing or should be routed differently.
Marketing
Marketing uses firmographic data to stop treating the market as one audience.
- Campaign segmentation: Enterprise and SMB buyers respond to completely different messages. Firmographic segmentation makes that separation operational.
- ABM target lists: Account-Based Marketing only works when the target list is built on real criteria. Firmographic fit is the baseline filter.
- Paid targeting: Firmographic filters in platforms like LinkedIn, including industry, company size, and geography, reduce wasted ad spend when used properly.
- Content personalization: Knowing a visitor’s firmographic profile lets you serve relevant case studies and messaging in real time.
RevOps
RevOps is where firmographic data becomes infrastructure.
- CRM enrichment: Every account record should have core firmographic fields populated and kept current. Gaps here mean your reports, segments, and scoring models are built on incomplete information.
- Lead scoring: Behavioral scoring tells you about intent. Firmographic scoring tells you about fit. A high-intent lead from the wrong company type is not the same as one from your ICP.
- Pipeline reporting by segment: Which firmographic segments close fastest? At what ACV? With what sales cycle length? This analysis informs where to invest.
- Forecasting: Companies that look like your best customers tend to behave like them. Firmographic segment performance becomes a reliable forecasting input over time.
Firmographic vs. Demographic vs. Technographic Data
These three data types work together in B2B but answer different questions.
| Data Type | What It Describes | Key Attributes | Primary Use |
|---|---|---|---|
| Firmographic | The company | Industry, size, revenue, location, ownership | Account targeting, ICP definition, segmentation |
| Demographic | The individual | Job title, seniority, department, tenure | Persona targeting, outreach personalization |
| Technographic | The tech stack | CRM in use, cloud platforms, marketing tools | Competitor displacement, integration messaging |
Think of it as a funnel of precision. Firmographic data narrows your universe to the right companies. Demographic data identifies the right person within those companies. Technographic data helps you tailor your pitch based on what they are already using.
Most teams treat firmographic as an afterthought. That is backwards. Confirm company fit before you worry about the contact’s title or tech stack.
The Filter, Segment, Activate Framework
Knowing the attributes is not the hard part. Turning them into a repeatable operating model is. Here is how to do it.
Step 1: Filter
Define your ICP using firmographic criteria specifically. Not mid-market SaaS, but B2B SaaS companies with 100 to 500 employees, $10M to $75M ARR, headquartered in North America, with a sales team of 20 or more.
Use your closed-won data to identify the pattern. The ICP is a discovery exercise, not a brainstorming one.
Step 2: Segment
Break your filtered market into two or three meaningful cohorts, typically by size, industry, or growth stage. Build distinct lists, scoring tiers, and messaging frameworks for each.
A 150-person company and an 800-person company may both be mid-market, but they have different buying processes, budget cycles, and stakeholder dynamics. Segment meaningfully, not arbitrarily.
Step 3: Activate
Apply firmographic segments across every live workflow:
- Sales prioritization lists
- Marketing campaign audiences
- Lead scoring weights in your CRM
- LinkedIn and paid targeting parameters
- Customer success tiering
Firmographic data is only useful when it is embedded in the systems your team uses every day. Review quarterly. Win and loss data by firmographic segment will tell you more about your actual ICP than any planning exercise.
Key takeaway: A framework only works if it is embedded in real workflows. Define, segment, activate, and then revisit.
How to Collect and Maintain Firmographic Data
Inbound Forms
Ask for company size, industry, or role on demo or signup forms. Keep it to two or three fields. Collect the minimum and enrich the rest.
Public and Manual Sources
LinkedIn company pages, SEC filings, government registries, and industry directories. Useful for one-off research but not scalable for maintaining a full CRM.
Third-Party Enrichment
This is how teams with any volume actually operate. A data platform appends firmographic attributes automatically at the point of entry and refreshes them on a schedule.
Where Does Firmographic Data Come From?
B2B teams collect firmographic data from several sources:
- Company websites
- LinkedIn company pages
- SEC filings and annual reports
- Government business registries
- Industry directories
- CRM enrichment providers
- Customer signup and demo forms
- Proprietary data collected through customer interactions, product usage, research, and first-party account intelligence
Most companies combine multiple sources to improve accuracy, coverage, and data freshness.
Where Pintel.AI Fits In
The real problem is not data collection. It is data decay. Most CRMs are not missing firmographic data because no one ever entered it. They are missing it because it went stale and no one noticed until a rep showed up pitching the wrong solution to the wrong-sized company.
Pintel.AI is built for B2B teams that need firmographic intelligence that is accurate, current, and embedded in their workflows. Here is how teams use it in practice:
- Automatic CRM enrichment: Firmographic fields are populated and refreshed continuously, so reps always work from current data.
- ICP-matched prospecting lists: Filter by industry, headcount, revenue, location, ownership type, and growth signals to surface accounts that match your defined profile.
- Fit-based lead scoring: Weight leads by company fit, not just behavioral signals.
- ABM list building: Build and export target account lists synced directly to ad platforms and outreach tools.
- Real-time change alerts: When a target account hits a growth trigger such as new funding or a leadership change, Pintel.AI flags it so your team can act at the right moment.
Key takeaway: The goal is not a bigger list. It is a more accurate one.
Data hygiene best practices regardless of tooling:
- Refresh firmographic data at minimum quarterly. Monthly is better for fast-moving segments.
- Enrich at the point of entry, not two weeks later.
- Audit CRM field completion across industry, headcount, and revenue before building any scoring model or campaign segment on top of it.
Six Mistakes That Undermine Firmographic Strategy
1. Treating Headcount as the Only Signal
A 200-person professional services firm and a 200-person e-commerce company have almost nothing in common as buyers. Combine headcount with industry and revenue for a meaningful filter.
2. Locking the ICP and Never Revisiting It
Your ICP from 18 months ago is probably wrong in some meaningful way. Win rates shift. New verticals emerge. Pull win and loss data by firmographic segment every quarter and let it update your assumptions.
3. Running Behavior-Only Lead Scoring
Behavioral signals tell you about intent. Firmographic data tells you about fit. Scoring purely on behavior means a high-intent lead from a company that will never convert scores the same as one from your best-fit segment. That is a prioritization failure.
4. Defining Firmographic Criteria Without Sales Buy-In
If RevOps or marketing builds the ICP and sales does not believe in it, the scoring model and campaign segments will not matter. Build firmographic criteria collaboratively. The people closest to the deal cycle know things the data does not.
5. Using Stale Data as if It Is Current
Company data decays fast. Headcount changes. Revenue shifts. Leadership turns over. Targeting based on 18-month-old firmographic data is like navigating with an outdated map.
6. Collecting Firmographic Data Without Building Segments
Data sitting in a CRM field is not doing anything. The value is in the segments you build from it and the actions those segments drive. Data without structure is not an asset. It is just storage.
Conclusion
Most B2B GTM problems trace back to the same root cause: targeting that is too broad, too inconsistent, or built on assumptions nobody has actually tested.
Firmographic data is the fix, but only if it is treated as operational infrastructure, not a one-time exercise. Define your ICP with real firmographic criteria. Build segments that mean something. Embed those segments into the systems your sales, marketing, and RevOps teams use every day.
The companies that win consistently in B2B do not have better pitches. They have better filters. They know which accounts are worth pursuing before the first email goes out.
That clarity starts with firmographic data. Tools like Pintel.AI exist to make sure that data stays accurate, current, and actionable, not just a set of fields your team filled in once and forgot about.
Know your market. Segment it properly. Work the right accounts. Everything else follows.
FAQ: Firmographic Data
What is firmographic data?
Firmographic data is a set of company-level attributes including industry, employee count, annual revenue, location, ownership type, and growth stage, used by B2B teams to classify, segment, and target business accounts.
How is firmographic data different from demographic data?
Demographic data describes individuals (job title, seniority, department). Firmographic data describes companies (size, industry, revenue). In B2B, you need both: firmographic data to identify the right company, demographic data to find the right person within it.
Why does firmographic data matter in B2B specifically?
Because B2B purchase decisions are organizational, not individual. The company’s size, industry, revenue, and structure determine whether they have the budget, the need, and the authority to buy. Targeting without firmographic clarity means guessing at all three.
What is firmographic segmentation?
The practice of dividing a target market into distinct cohorts based on shared company characteristics: separating SMB, mid-market, and enterprise accounts, or grouping by industry vertical. Each segment gets different messaging, different scoring weight, and often a different sales motion.
What firmographic attributes matter most?
Industry (with sub-vertical where possible), employee headcount, annual revenue, HQ location, and ownership type. Growth stage and funding status are increasingly important for accounts in tech and venture-backed sectors.
How often should firmographic data be refreshed?
Quarterly at minimum. Companies change faster than most teams expect. Real-time enrichment tools like Pintel.AI automate this so you are not manually auditing records on a schedule.
Can firmographic data be used in lead scoring?
Yes, and it should be. A scoring model that ignores firmographic fit is measuring engagement without measuring relevance. Add firmographic criteria as a fit layer: accounts that match your ICP on industry, size, and revenue should receive a score multiplier regardless of behavioral signals.
What is the difference between firmographic and technographic data?
Firmographic data tells you what a company is. Technographic data tells you what tools a company uses. Start with firmographic to identify the right accounts, then layer in technographic to sharpen your pitch.