Most B2B revenue teams measure lead volume when they should be measuring lead quality. When marketing celebrates MQL numbers while sales rejects leads, the disconnect reveals a measurement system optimized for activity rather than outcomes.
This framework redefines lead quality as a revenue measurement system, one that moves beyond demographic scores and engagement thresholds to continuous measurement of how lead attributes predict pipeline contribution and closed revenue.
In this guide, you’ll learn: How to measure lead quality in B2B using a four-layer framework (fit, intent, buying committee, revenue correlation), which lead quality metrics actually predict pipeline outcomes, and how to operationalize quality measurement across marketing, sales, and RevOps teams.

What Is Lead Quality in B2B?
In simple terms: Lead quality represents the probability that a contact will progress through your pipeline and generate revenue based on their organizational fit, buying authority, demonstrated intent, and account context.
Measuring lead quality in B2B differs from lead scoring or qualification. Lead scoring assigns points to individual attributes. Lead qualification determines if a lead meets the minimum criteria. Lead quality measures the compound effect of multiple signals in predicting revenue outcomes.
Traditional definitions treat lead quality as binary: qualified or unqualified, MQL or not MQL. This oversimplifies a spectrum of revenue potential. A director at a 5,000-person enterprise has different quality characteristics than a VP at a 200-person company, even if both meet your MQL threshold. Both are quality leads but require different treatment and velocity expectations.
The shift from volume-based to quality-based thinking requires redefining success metrics. MQL volume becomes less important than MQL-to-revenue conversion rate. Marketing and sales align around shared definitions of what “good” looks like, measured by revenue outcomes rather than process milestones.
Why Most Lead Quality Models Break at Scale
Lead quality frameworks that work for 100 leads per month break down at 1,000 leads per month because they depend on manual judgment that can’t scale. As volume increases, teams default to automated scoring models that oversimplify quality assessment.
Over-Reliance on Demographic Scoring
Most lead scoring models assign static point values to firmographic attributes: company size, industry, job title, geography. A director at a 500-person technology company gets the same score whether they’re evaluating solutions actively or casually browsing.
When demographic data quality degrades, scoring models systematically misroute leads. If 30% of your leads have incorrect job titles or outdated company information, the highest-scored leads become those with the most complete data enrichment, not those with the highest revenue potential. Sales teams waste capacity on contacts who have the right title at the right company but no project, no budget, and no timeline.
Intent Signals Without Context
Second-generation lead quality models layer intent signals on top of demographic scoring: website visits, content downloads, webinar attendance, email engagement. This improves on pure demographic scoring but still misses critical context.
A manager downloading five whitepapers shows high intent. But if that manager has no budget authority or works at a company too small to implement your solution, the intent signals engagement without buying power. Intent-based scoring inflates MQL numbers with engaged contacts who can’t buy, creating friction when sales rejects leads that marketing considers qualified.
MQL Thresholds Disconnected from Pipeline
Most MQL thresholds get set during initial marketing automation setup and never get recalibrated against actual pipeline outcomes. The threshold becomes arbitrary once business conditions change. When you shift focus from mid-market to enterprise, your MQL criteria should adjust to reflect longer sales cycles and different buying patterns.
Miscalibrated MQL thresholds create two failure modes. Thresholds set too low generate high MQL volumes of poor quality leads that sales rejects. Thresholds set too high filter out genuine opportunities that don’t fit the scoring model’s assumptions. Both scenarios damage pipeline predictability.
Marketing-Sales Misalignment on Quality Definitions
Marketing defines lead quality using data available in marketing automation: engagement scores, demographic attributes, behavioral signals. Sales defines lead quality based on discovery conversations: validated budget, confirmed authority, articulated pain, agreed timeline.
When marketing’s quality definition prioritizes engagement and sales’ quality definition prioritizes buying readiness, the handoff breaks. Quality definition misalignment shows up as poor MQL-to-SQL conversion rates and increasing lead rejection rates. Marketing increases spend to hit MQL targets while sales disqualifies higher percentages, keeping pipeline flat despite rising investment.
Understanding why traditional lead quality models fail sets the foundation for building a framework that actually predicts revenue outcomes.
How to Measure Lead Quality: A Four-Layer Framework
Effective lead quality measurement requires a layered framework that evaluates multiple dimensions of revenue probability. Each layer adds specificity, moving from broad fit assessment to precise revenue prediction.
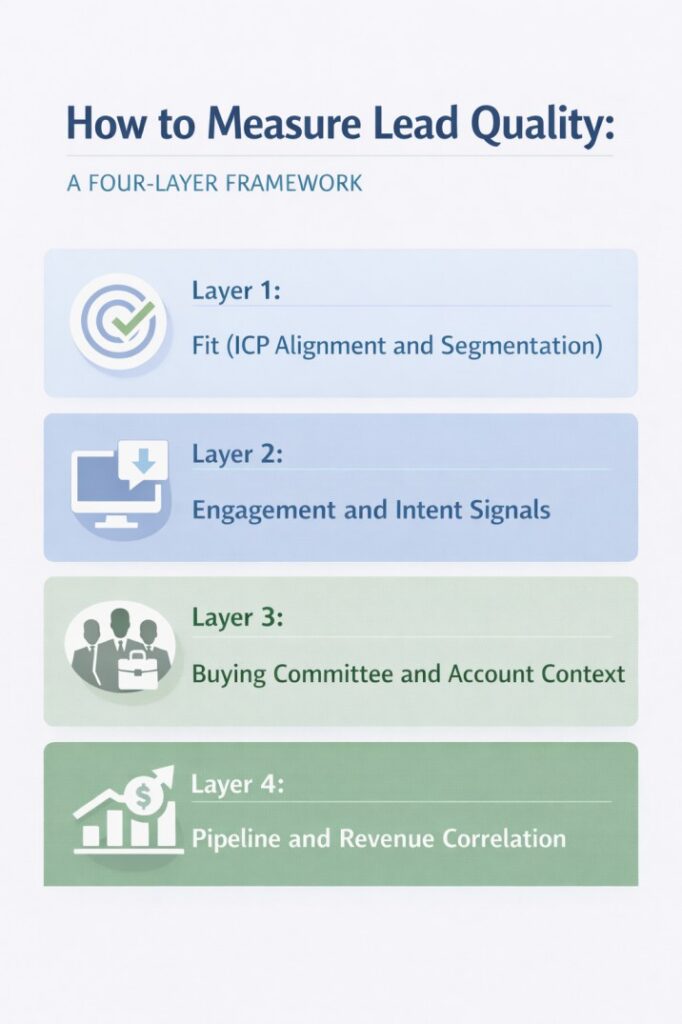
Layer 1: Fit (ICP Alignment and Segmentation)
Fit establishes whether a lead represents an account that matches your ideal customer profile across the attributes that correlate with successful customer outcomes.
What to measure:
- Company revenue band and employee count relative to implementation requirements
- Industry vertical alignment with product capabilities and competitive positioning
- Technology environment and existing stack compatibility
- Geographic market and language coverage
How to operationalize:
Create tiered fit scores based on attribute combinations that predict revenue outcomes.
Tier 1 accounts meet all fit criteria at high confidence.
Tier 2 accounts meet most criteria with acceptable tradeoffs.
Tier 3 accounts require exceptions. Tier 4 accounts don’t fit your business model.
Route leads differently by fit tier.
Tier 1 leads get immediate sales assignment.
Tier 2 leads enter qualification workflows.
Tier 3 leads the route to specialized teams.
Tier 4 leads get suppressed from active workflows.
Revenue connection:
Fit determines deal size, implementation complexity, retention probability, and expansion potential. Poor-fit accounts might buy, but they churn faster and expand less. Measure fit quality by analyzing closed-won deals: what percentage came from Tier 1 vs Tier 2 accounts? What were the average deal sizes by tier? Use this to recalibrate tier definitions quarterly.
Layer 2: Engagement and Intent Signals
Once fit is established, engagement and intent signals indicate timing and buying stage. These signals matter only in the context of fit. High engagement from poor-fit accounts produces research activity. High engagement from good-fit accounts suggests active evaluation.
What to measure:
- First-party engagement: product page visits, pricing page views, demo requests, trial signups
- Third-party intent: job postings, technology changes, funding events, competitor research
- Engagement patterns: frequency, recency, content progression from awareness to decision content
- Account-level signals: multiple contacts engaging, buying committee expansion
How to operationalize:
Build separate intent scoring that runs independently of fit scoring. A quality lead needs both high fit and high intent. Leads with high fit and low intent enter nurture. Leads with high intent and low fit get deprioritized.
Implement decay functions on intent signals. Website activity from 60 days ago is less meaningful than activity from 3 days ago. Engagement scores should decrease over time unless refreshed by new activity.
Revenue connection:
Intent signals indicate timing and velocity. Measure intent quality by correlating intent scores at lead creation with time-to-close for won deals. If high-intent leads don’t close faster than low-intent leads, your intent signals aren’t measuring buying readiness.
Layer 3: Buying Committee and Account Context
Complex B2B purchases involve multiple stakeholders. Quality lead assessment must evaluate both individual contacts and account-level buying committee composition.
What to measure:
- Contact coverage across buying committee roles (economic buyer, technical buyer, champion, influencer)
- Seniority distribution: decision-makers vs influencers
- Account engagement breadth: single contact vs multiple engaged contacts
- Buying process indicators: RFP activity, budget cycle timing, competitor evaluation
How to operationalize:
Implement account-level quality scoring that aggregates contact-level signals. An account with one highly-engaged VP has different quality than an account with three moderately-engaged directors across departments. The multi-threaded account shows broader organizational interest.
Build buying committee gap analysis into qualification workflows. If you’re only connected to technical buyers but lack economic buyer access, route differently than opportunities with fully-mapped committees.
Revenue connection:
Buying committee breadth drives deal size and close probability. Deals with multiple engaged stakeholders close at higher rates and larger ACVs. Analyze won vs lost deals to identify which committee structures correlate with wins and use this to build predictive models.
Layer 4: Pipeline and Revenue Correlation
The ultimate validation of lead quality is actual pipeline contribution and revenue outcomes. This layer closes the feedback loop by measuring whether leads with specific quality profiles actually generate revenue at predicted rates.
- What to measure:
- Lead-to-opportunity conversion rate by quality segment
- Opportunity-to-close conversion rate by originating lead quality
- Average deal size by lead source and quality tier
- Sales cycle length by quality profile
- Pipeline velocity: how quickly do high-quality leads move through stages?
How to operationalize:
Build cohort analysis that tracks lead quality metrics from first touch through closed revenue. Tag leads with their quality scores at creation, then append opportunity and customer data as it becomes available. Run quarterly reviews comparing predicted quality with realized quality, then recalibrate scoring models based on these insights.
Revenue connection:
Calculate revenue per lead by quality segment. If Tier 1 leads generate 10 times more revenue per lead than Tier 2 leads, that justifies different acquisition costs and handling processes. This measurement validates whether your quality scores correlate with actual revenue.
With this four-layer framework established, the operational challenge becomes embedding it into daily workflows across GTM teams.
How to Operationalize Lead Quality Across GTM Teams
A lead quality framework only matters if it changes how teams work. Operationalization means translating quality measurement into routing logic, rep assignment, and performance metrics.
Marketing’s role:
Marketing owns upstream quality by controlling lead acquisition channels and targeting parameters. Shift metrics from MQL volume to MQL quality, measured by downstream conversion.
Implement quality thresholds at lead capture, build targeting parameters around quality profiles, and create channel-specific quality benchmarks. Report quality lead metrics alongside volume: MQLs generated, average quality score, percentage in Tier 1/2/3, and MQL-to-opportunity rate by tier.
SDR’s role:
SDRs validate system-generated quality scores through direct outreach. They confirm fit, validate intent, and assess buying committee access.
Implement structured discovery frameworks that SDRs complete before SQLing leads: budget validated, authority confirmed, need articulated, timeline established. Build quality-based SLAs: Tier 1 leads get same-day follow-up, Tier 2 get 48-hour follow-up.
Create structured disqualification taxonomies that feed back to marketing for continuous improvement.
AE’s role:
Account executives provide ultimate quality validation through closed deals. When opportunities close-won or closed-lost, append quality data back to originating lead records.
Build win/loss analysis by quality profile to identify which attributes predicted wins. Create quality-adjusted forecasting where opportunities from high-quality leads get higher confidence weighting.
RevOps’ role:
RevOps owns the analytical infrastructure, scoring logic, and performance measurement that make quality operationalization possible.
Build quality dashboards showing lead quality distribution, conversion rates by tier, and revenue by segment. Implement automated quality monitoring that alerts when scores drift from historical patterns. Own scoring model calibration through quarterly analyses correlating quality metrics with revenue outcomes.
Once you’ve operationalized lead quality across GTM teams, the next critical step is identifying which metrics actually indicate quality and predict revenue performance.
Lead Quality Metrics That Matter
Volume metrics like MQL count measure activity, not outcomes. Lead quality metrics measure how efficiently leads convert to revenue.
Lead-to-opportunity rate by quality segment:
This validates that your quality scoring predicts pipeline entry. Calculate by quality segment: Tier 1 leads might convert at 25%, Tier 2 at 12%, Tier 3 at 4%. If conversion rates don’t vary significantly by tier, your quality model isn’t discriminating.
For example, if a SaaS company processes 1,000 leads monthly with 200 in Tier 1 (25% conversion = 50 opportunities), 500 in Tier 2 (12% conversion = 60 opportunities), and 300 in Tier 3 (4% conversion = 12 opportunities), they generate 122 total opportunities. If they shifted mix to 300 Tier 1 leads instead, they’d generate 75 opportunities from that tier alone—a 50% increase from the same total lead volume. Track monthly to identify quality drift.
Opportunity value by lead source and quality:
Calculate average opportunity size for leads from each source and quality tier. High-quality leads should generate larger opportunities on average. Use this to inform acquisition strategy and validate that quality scoring correlates with deal size.
Pipeline velocity by quality profile:
Measure how quickly leads with different quality profiles move through pipeline stages. High-quality leads should progress faster because they have better fit, clearer intent, and more complete buying committee engagement. Calculate average days-in-stage for opportunities by originating lead quality.
Revenue per quality lead:
This is the ultimate quality metric. Track cohorts through full revenue realization. Leads from Q1 tracked through opportunities closed in Q2-Q4, with revenue recognized. If Tier 1 leads generate $50K revenue per lead and Tier 2 generates $8K, that justifies six times higher acquisition costs for Tier 1.
Win rate by qualification tier:
Measure what percentage of opportunities from each quality tier ultimately close-won. Calculate win rate by the quality score assigned at lead creation. If win rates vary significantly by tier, you can use quality scores for forecast weighting and capacity planning.
These metrics form the foundation of quality-based revenue operations. But modern GTM teams are moving beyond manual scoring to signal-based intelligence that continuously refines quality assessment in real time.
How Signal Intelligence Is Changing Lead Quality Measurement
Traditional lead quality models depend on explicit signals: form submissions, content downloads, email clicks. Modern signal intelligence layers implicit signals from multiple sources to build richer quality pictures.
Multi-source signal integration in practice:
Revenue teams now combine behavioral data from websites with technographic data showing tool usage, firmographic data from enrichment vendors, intent data showing competitor research, and engagement data across channels. The value isn’t in individual signals but in signal correlation.
Example: A prospect with recent Series B funding ($30M), active job postings for a VP of Sales, and technology changes indicating CRM migration shows different quality than a prospect who only downloaded a whitepaper. The combination of signals provides context that individual signals lack.
Real-time scoring and prioritization:
Static lead scores assigned at creation are giving way to real-time scoring that continuously incorporates new signals. A lead that was low-quality last month but showed sudden activity spikes this week should jump the queue. A lead that was high-quality at creation but showed zero follow-up engagement should decay in priority.
Modern revenue intelligence platforms enable this by recalculating scores on event triggers (new engagement, data enrichment update, job change) rather than batch processing daily. Sales teams always work the highest-quality leads based on current information, not stale assessments.
Practical implementation:
The shift to signal-based quality measurement requires infrastructure to ingest multiple data sources, normalize conflicting information, and build scoring models that weight signal combinations. Teams that enforce quality at the data layer through multi-source validation reduce manual research work and protect rep capacity before leads ever reach sales.
The path forward combines interpretable scoring for core quality dimensions (fit, intent, committee) with signal intelligence for fine-tuning. This hybrid approach maintains transparency while capturing predictive signals from complex data patterns.
Lead Quality Is a Competitive Moat, Not a Marketing Metric
Lead quality in B2B must evolve from static qualification checkpoints to a continuous revenue measurement system. The four layer framework outlined here focuses on fit, intent, buying committee, and revenue correlation, shifting quality from activity tracking to outcome prediction. When measured against conversion rates, pipeline value, and revenue per lead, quality becomes an operating system for resource allocation across GTM teams.
Start by establishing baseline conversion and revenue metrics across your current lead flow. Then implement tiered scoring that separates fit from intent and routes leads accordingly. One mid market SaaS company struggling with 8% MQL to customer conversion applied this approach and discovered Tier 1 leads converted at 22% while Tier 3 converted at 2%. By reallocating budget toward Tier 1 profiles, overall conversion increased to 14% and average deal size grew 35% within two quarters. The advantage came not from generating more leads, but from prioritizing the right ones.
Lead quality is not a marketing initiative. It is a revenue architecture decision that determines how efficiently you convert market opportunity into predictable growth.
Frequently Asked Questions
What’s the difference between lead quality and lead scoring?
Lead scoring assigns point values to individual attributes based on rules or models. Lead quality measures the combined probability that a lead will generate revenue based on multiple correlated factors. A lead can score highly but have low quality if those attributes don’t predict revenue outcomes in your business.
How do you measure lead quality metrics in practice?
Calculate lead-to-opportunity conversion rates segmented by key attributes (source, company size, job level). Measure opportunity-to-close rates and average deal size by these same segments. Revenue per lead by segment becomes your core quality metric. Track monthly to validate that quality scoring predicts actual outcomes.
What lead quality metrics matter most for B2B?
Lead-to-opportunity rate by quality tier, average opportunity value by lead source, pipeline velocity by quality profile, win rate by originating lead quality, and revenue per lead by quality segment. These connect early-stage quality assessment to pipeline outcomes and revenue realization.
How does lead quality affect revenue in B2B sales?
Lead quality determines pipeline conversion efficiency. Quality leads convert to opportunities at higher rates, close faster, generate larger deals, and retain better as customers. The cumulative effect of 10% to 20% quality improvement compounds into 50% to 100% revenue impact through improved conversion at every funnel stage.